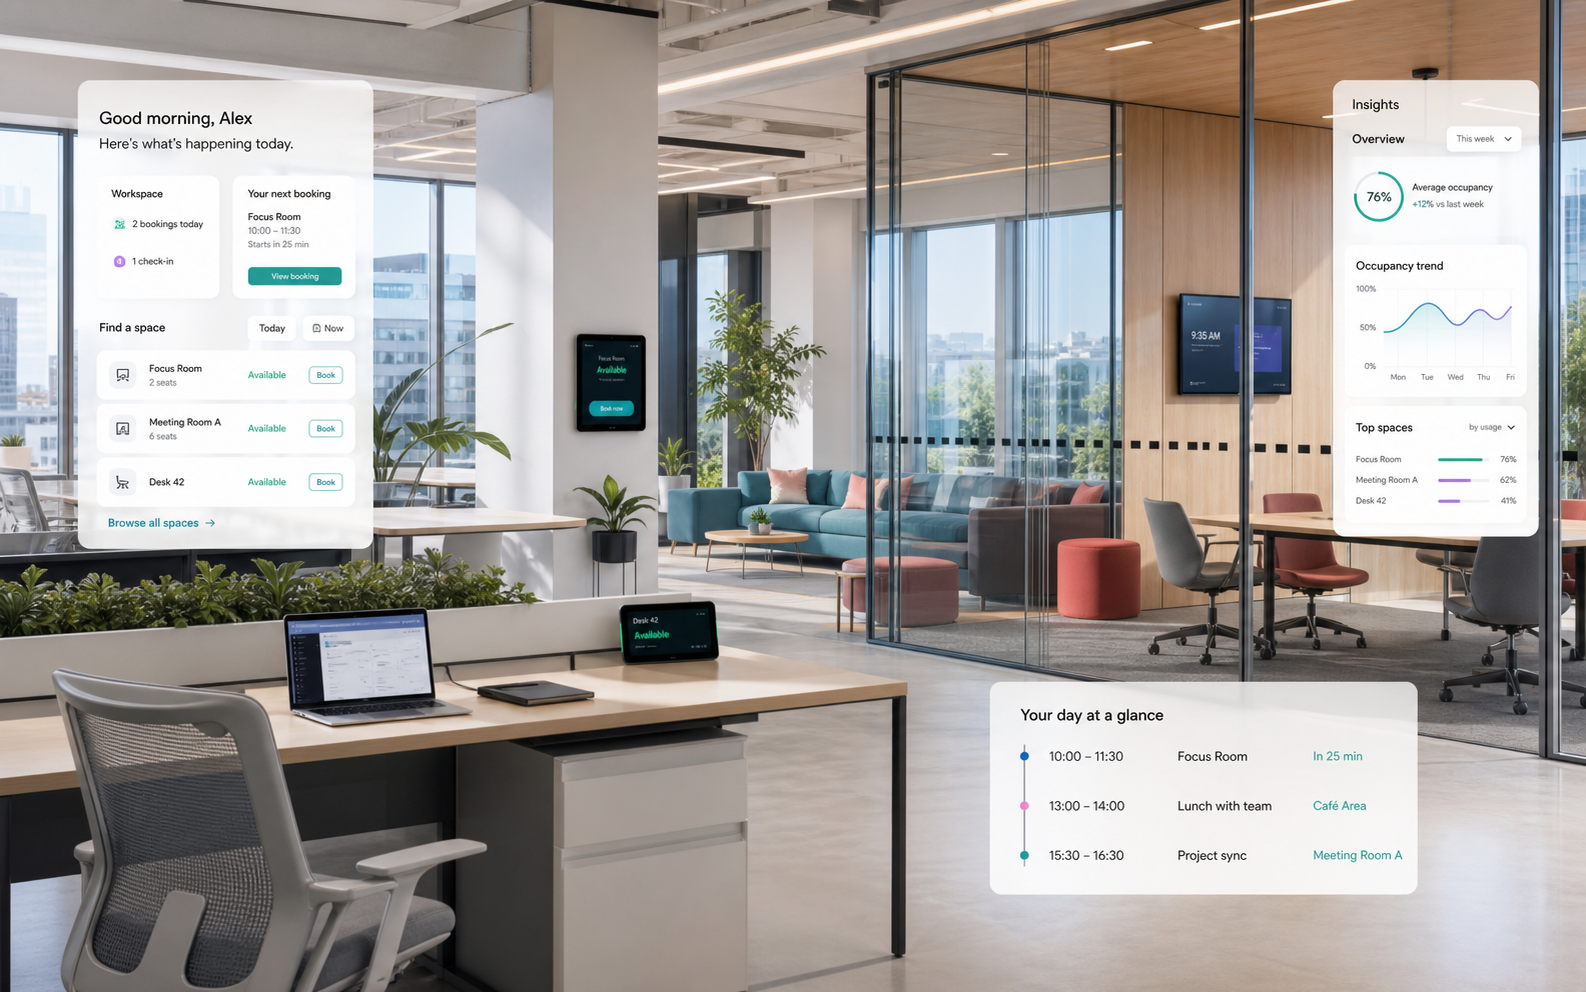


Utilization dashboards
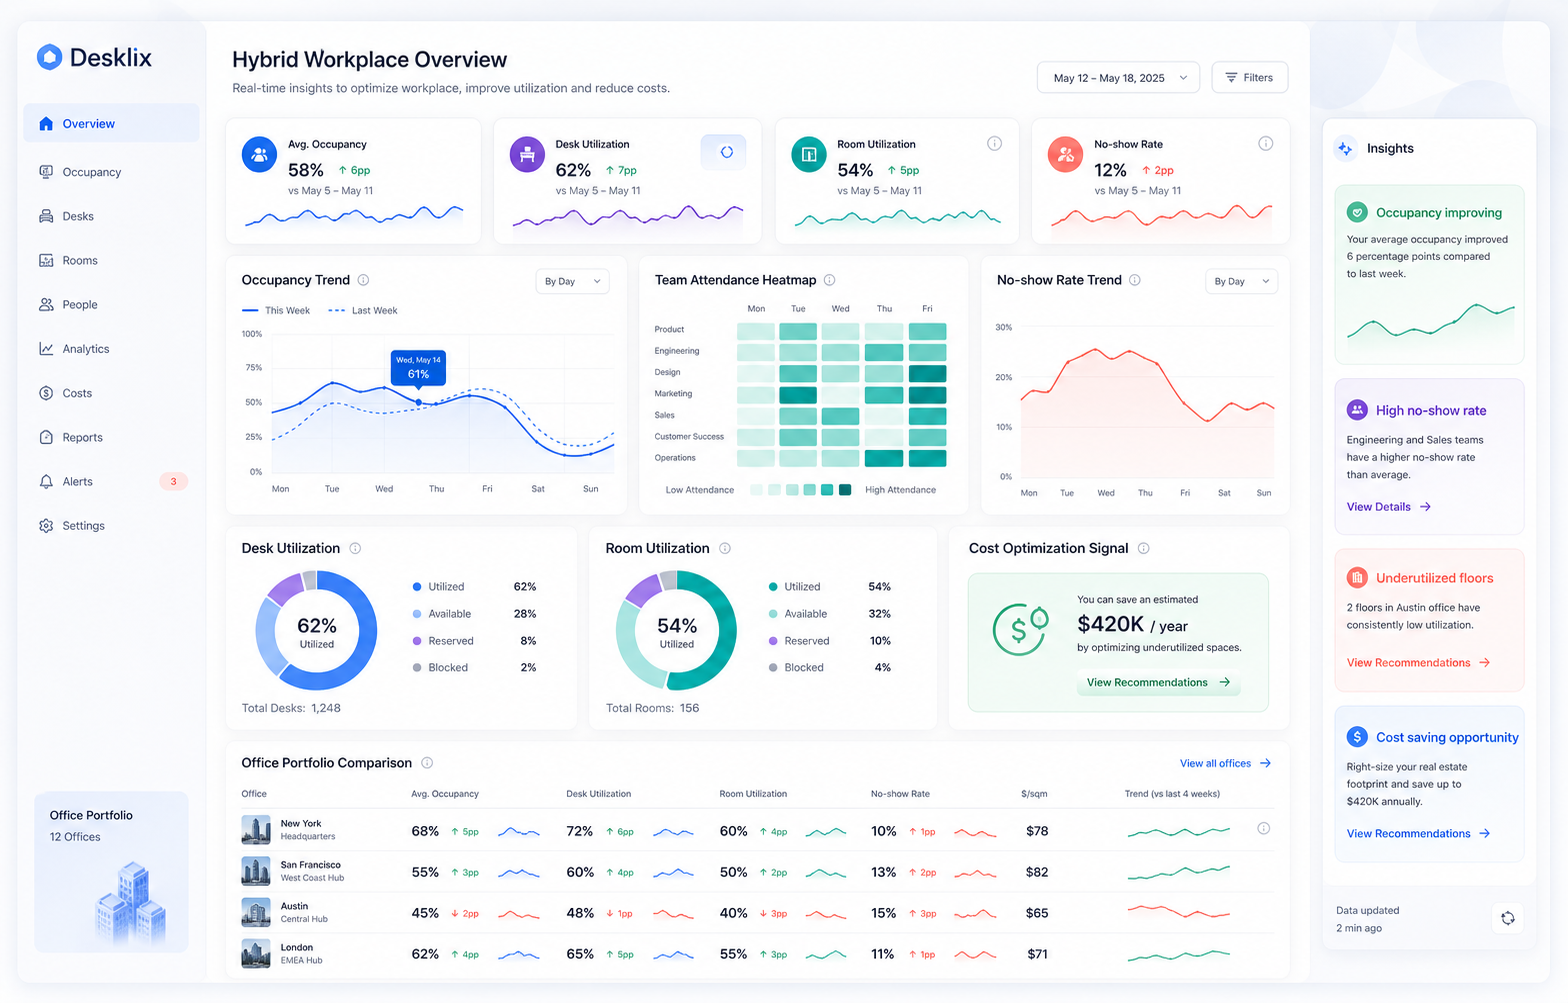
Compare bookings, check-ins, attendance, desk demand, room demand, users, resources, and workforce signals over time.
Workplace analytics
See how desks, rooms, floors, and teams are used so leaders can improve experience while reducing wasted capacity.
Capabilities
The capabilities are tied to real workplace workflows so value, setup, and operations stay clear.
Compare bookings, check-ins, attendance, desk demand, room demand, users, resources, and workforce signals over time.
Spot underused floors, overloaded neighborhoods, no-show patterns, booking frequency, and consolidation opportunities.
Use admin, resource, user, workforce, and personal analytics with date ranges, filters, CSV exports, and privacy-aware summaries.
Feature checklist
Desk, room, floor, and site utilization
Attendance and planned office-day trends
No-show and release-rate reporting
Team and neighborhood demand views
Resource dashboard for booking frequency, booking counts, zones, and demand pressure
User and workforce dashboards for coverage, adoption, and hybrid-work patterns
Date range controls, filters, tables, and CSV exports
Portfolio comparison across locations
Privacy-aware aggregation and export-ready summaries
Workflow
Resources, roles, locations, and rules are modeled cleanly once.
Employees get fast workflows for planning, booking, and arrival.
Workplace teams use signals to improve capacity, services, and policies.
Operational impact
See how desks, rooms, floors, and teams are used so leaders can improve experience while reducing wasted capacity.
FAQ
Bookings, check-ins, resources, floors, teams, and time windows.
Yes. Utilization patterns can frame consolidation and investment decisions.
Yes. Reporting supports aggregated and privacy-aware views.
Start with a focused pilot
Launch the first Desklix workflows with real teams, real spaces, and useful planning data.